Zoho Analytics: Self-Service Business Intelligence (BI) Platform
Unlock The Power Of Your Data
With Zoho Analytics
Business Intelligence Made Simple
Harness the power of Zoho's advanced Business Intelligence tools to gain deep insights into your data. Zoho Analytics allows you to create interactive reports and dashboards that are not only visually appealing but also incredibly informative.
Advanced Data Analytics
Delve deeper into your data with Zoho's robust Data Analytics capabilities. Utilise predictive analytics and AI-powered insights to forecast trends and make informed decisions that drive your business forward.
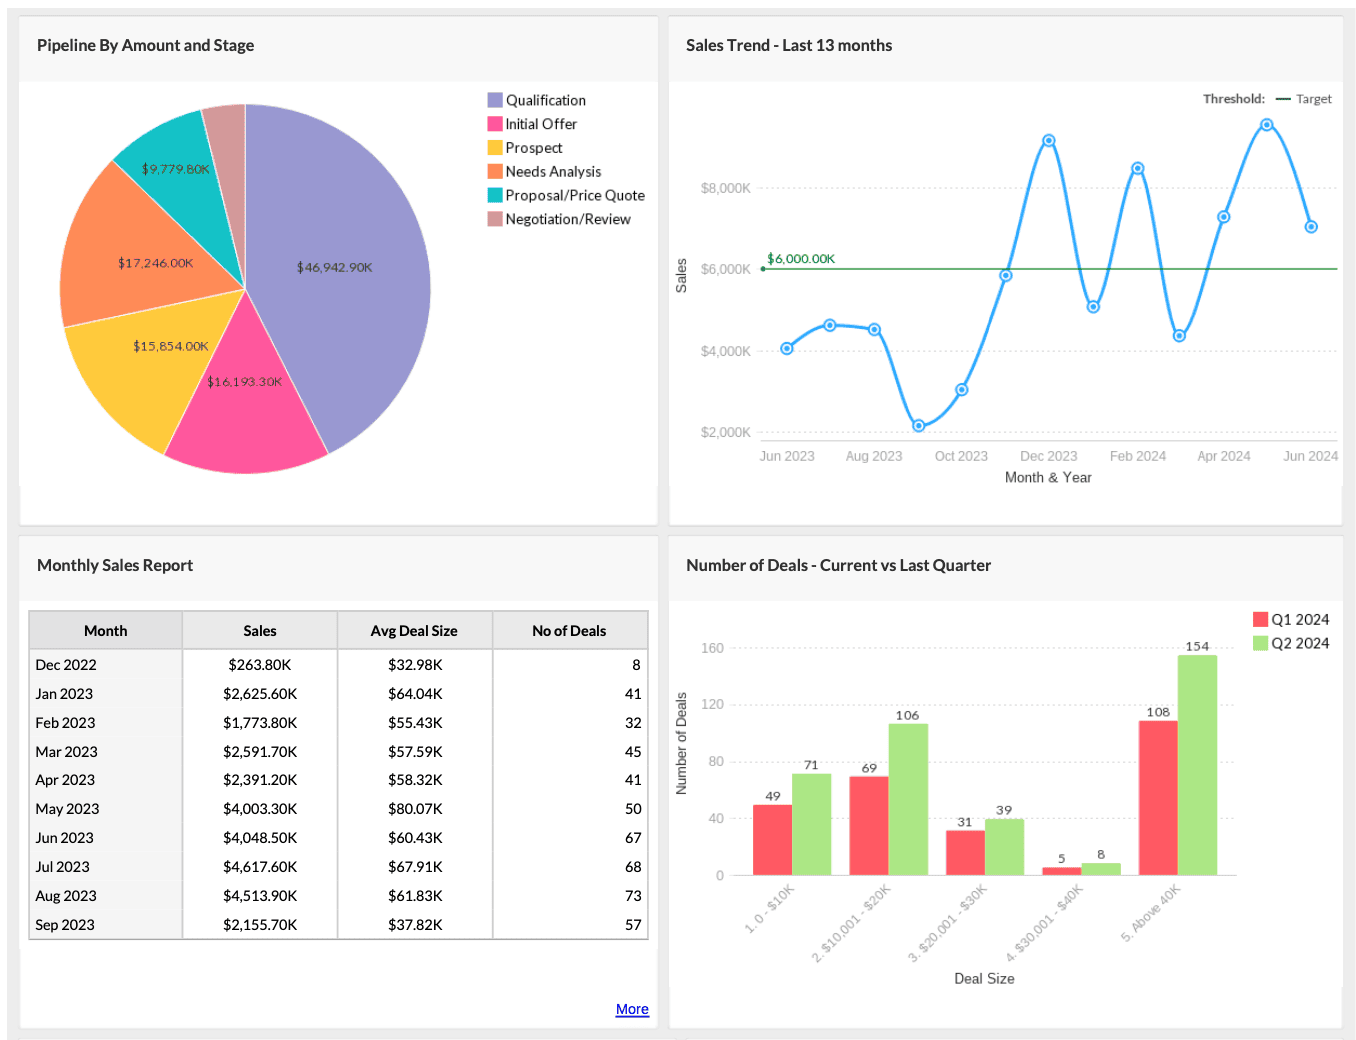
Stunning Data Visualisation
Transform complex data sets into stunning visualisations. Choose from a wide range of visualisation tools such as charts, widgets, and maps to create dashboards that highlight key performance indicators (KPIs) and uncover hidden patterns.
Unlock Powerful Insights With Zoho Analytics
Unlock Powerful Insights With Zoho Analytics
Seamless Data Integration
Integrate Zoho Analytics with over 250 data sources including cloud storage services, business applications, and databases. Zoho's seamless data integration ensures that all your data is centralised, providing a holistic view of your business operations.
Collaborative Analytics
Share insights and collaborate with your team effortlessly. Zoho Analytics allows you to publish and share reports securely, ensuring that everyone in your organisation has access to the data they need to succeed.
Scalable and Secure
Zoho Analytics grows with your business, offering scalable solutions that adapt to your expanding data needs. Enjoy enterprise-grade security with features like data encryption, role-based access control, and secure data transmission to keep your information safe.
How Kings Secure Technologies Mastered Data with Zoho Analytics
Discover how a £60 million business, Kings Secure Technologies (KSTL), transformed its reporting with Zoho Analytics. Moving beyond basic spreadsheets, KSTL partnered with 1 Cloud Consultants, a Zoho Partner, to unlock sophisticated data analysis. This case study reveals how a dedicated "Zoho Champion" and a tailored data strategy streamlined global operations and provided deep, actionable insights.